
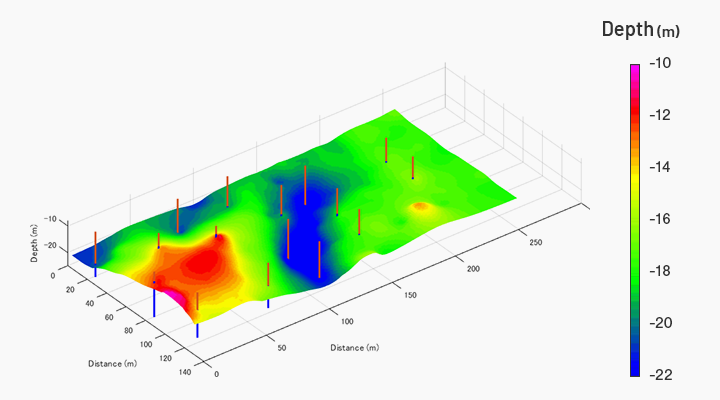
Microtremor Test in Bangladesh
Microtremor Test in Bangladesh is a passive seismic geophysical investigation technique used to measure very small, naturally occurring ground vibrations known as microtremors or ambient vibrations. Unlike active seismic methods that require a controlled source such as a hammer, weight drop, or vibrator, microtremor surveys generally use vibrations that are already present in the environment. These vibrations may be generated by:
- Road traffic
- Railway movement
- Industrial machinery
- Construction activity
- Human activity
- Wind
- Oceanic and atmospheric processes
- Natural seismic sources
A sensitive seismic instrument records these small ground motions over a selected period. The recorded data can then be analyzed in the time and frequency domains to investigate the dynamic characteristics of the site.
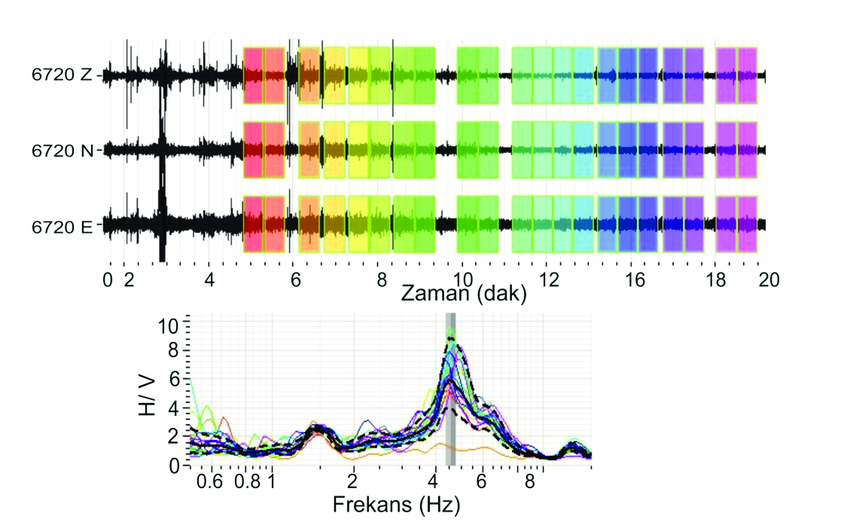
One of the most common approaches is the Horizontal-to-Vertical Spectral Ratio (HVSR) method, where the horizontal components of ground motion are compared with the vertical component to identify significant frequency peaks.
Microtremor surveys can provide useful information about:
- Predominant site frequency
- Fundamental frequency
- Ground resonance characteristics
- Subsurface impedance contrasts
- Sediment thickness
- Seismic site response
- Geological variation
- Urban seismic characteristics
The technique is particularly useful for earthquake engineering, seismic microzonation, geological investigation, urban planning, and supplementary site characterization.
QC LAB SOLUTION can provide professional microtremor survey and ambient vibration measurement services in Bangladesh for buildings, infrastructure, geological studies, seismic hazard assessment, and engineering site characterization.
What Is a Microtremor Test?
A microtremor test measures naturally occurring, low-amplitude ground vibrations at a particular location. The vibrations are normally too small to be felt by people but can be detected by sensitive seismic instruments. A typical microtremor measurement uses a three-component seismic sensor capable of recording:
- Horizontal X component
- Horizontal Y component
- Vertical Z component
The instrument records ground motion continuously for a specified duration. The recorded data can then be processed to determine the frequency characteristics of the site.
A simplified workflow is:
Ambient Vibration → Three-Component Recording → Signal Processing → Frequency Analysis → HVSR/Spectral Analysis → Site Interpretation
Microtremor testing is closely associated with HVSR analysis, although microtremor measurement and HVSR analysis are not exactly the same thing.
Microtremor is the measured ambient vibration. HVSR is one analytical method applied to those recorded vibrations.
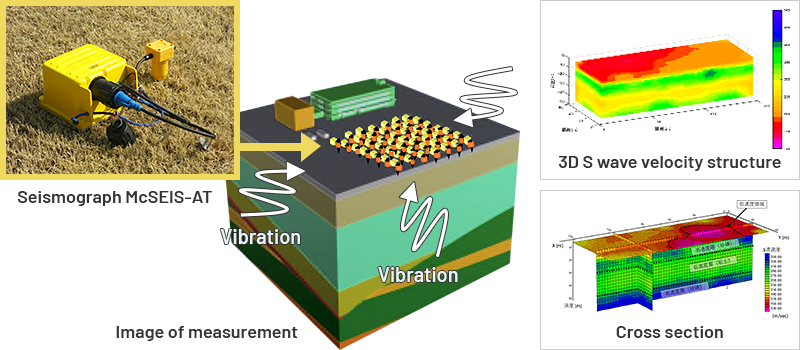
Principle of Microtremor Testing
The principle is based on the response of seismic waves to subsurface geological conditions. When ambient vibrations travel through the ground, their characteristics are influenced by:
- Soil stiffness
- Layer thickness
- Density
- Shear-wave velocity
- Geological boundaries
- Impedance contrasts
- Damping
- Surface conditions
Suppose a site consists of:
Soft Sediment
over
Hard Rock
The strong contrast between the two materials can produce characteristic resonance behavior.
Microtremor recording captures this response.
Frequency-domain analysis can then identify dominant frequency characteristics.
For a simplified single-layer soil-over-bedrock model, the fundamental frequency can be approximated by:
f₀ ≈ Vs / 4H
where:
- f₀ = fundamental frequency
- Vs = representative shear-wave velocity
- H = thickness of the sedimentary layer
Therefore:
H ≈ Vs / 4f₀
This relationship is useful for conceptual interpretation, but it should not be treated as a direct measurement of soil thickness because real geological conditions are often much more complex.
Microtremor and HVSR
Microtremor surveys are frequently processed using the Horizontal-to-Vertical Spectral Ratio (HVSR) method.
Three components are recorded:
H1 = Horizontal Component 1
H2 = Horizontal Component 2
V = Vertical Component
The horizontal and vertical frequency spectra are calculated.
A representative horizontal spectrum is then compared with the vertical spectrum.
A simplified expression is:
H/V = Horizontal Spectral Amplitude / Vertical Spectral Amplitude
The resulting curve is plotted against frequency.
A clear and stable peak may indicate the site's predominant frequency.
Therefore:
Microtremor = Ambient vibration measurement
HVSR = One method of analyzing microtremor data
This distinction is important when preparing technical reports and service descriptions.
Why Is Microtremor Testing Important?
Buildings and infrastructure do not respond identically to earthquake shaking at every frequency. Ground conditions influence the way seismic energy is amplified or modified. For example, thick soft sediment can have a different dynamic response from shallow competent rock. Understanding the site's predominant frequency can therefore provide useful information for:
- Earthquake engineering
- Site-response studies
- Seismic microzonation
- Urban planning
- Structural assessment
- Geological interpretation
Microtremor testing is particularly useful because it can be conducted without generating large active seismic sources. This makes the method attractive for densely developed urban environments.
Microtremor Testing in Bangladesh
Bangladesh has extensive areas of unconsolidated and relatively young sediments, particularly across the major river and deltaic systems. The country's cities and industrial regions are also undergoing rapid development.
Major infrastructure includes:
- High-rise buildings
- Bridges
- Expressways
- Metro systems
- Railway projects
- Industrial facilities
- Ports
- Power p lants
- Large commercial developments
U nderstanding subsurface dynamic characteristics can therefore be valuable for earthquake-risk assessment and infrastructure planning. Microtremor surveys can potentially support:
- Urban seismic microzonation
- Predominant-frequency mapping
- Site-response studies
- Sedimentary basin investigations
- Geological characterization
- Earthquake hazard assessment
Dhaka and other rapidly developing urban areas can particularly benefit from supplementary passive seismic measurements where large-scale active seismic surveys are difficult to conduct. However, microtremor data should be interpreted together with geological, geotechnical, and seismic-velocity information.
Market Growth and Industry Trends
The increasing importance of earthquake resilience and advanced site characterization is encouraging the use of geophysical investigation techniques alongside conventional geotechnical testing.
Traditional investigations such as:
- Boreholes
- SPT
- CPT
- Laboratory soil testing
remain essential.
However, these techniques generally provide point-based information.
Microtremor surveys can provide additional information about the dynamic frequency characteristics of the ground and can be performed at numerous locations relatively efficiently.
This makes microtremor particularly attractive for:
Urban Microzonation
Multiple measurement points can be used to develop frequency maps.
Earthquake Studies
Microtremor data can contribute to regional seismic-response investigations.
Building Studies
The method can help characterize ground vibration characteristics around buildings.
Infrastructure Planning
Long corridors and large development areas can be investigated using strategically selected measurement points.
Research
Universities and research institutions can use microtremor data for:
- Seismic studies
- Geological research
- Basin characterization
- Earthquake engineering
- Site-response modeling
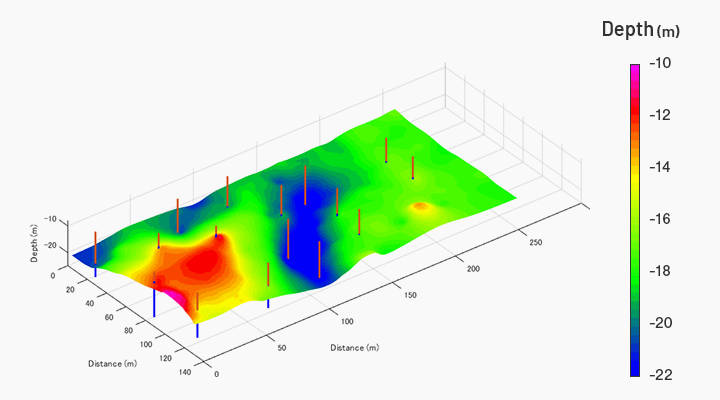
Key Types of Microtremor Investigation
1. Single-Station Microtremor Measurement
A single location is measured to characterize local ambient vibration and frequency response.
It is suitable for:
- Preliminary site assessment
- Building-site investigation
- Research
- Local seismic characterization
2. Multi-Station Microtremor Survey
Measurements are taken at multiple locations.
The results can be compared to identify spatial variation in:
- Predominant frequency
- Spectral characteristics
- Ground response
3. HVSR Microtremor Survey
This is one of the most widely used approaches. Three-component ambient vibration data are processed to calculate H/V spectral ratios.
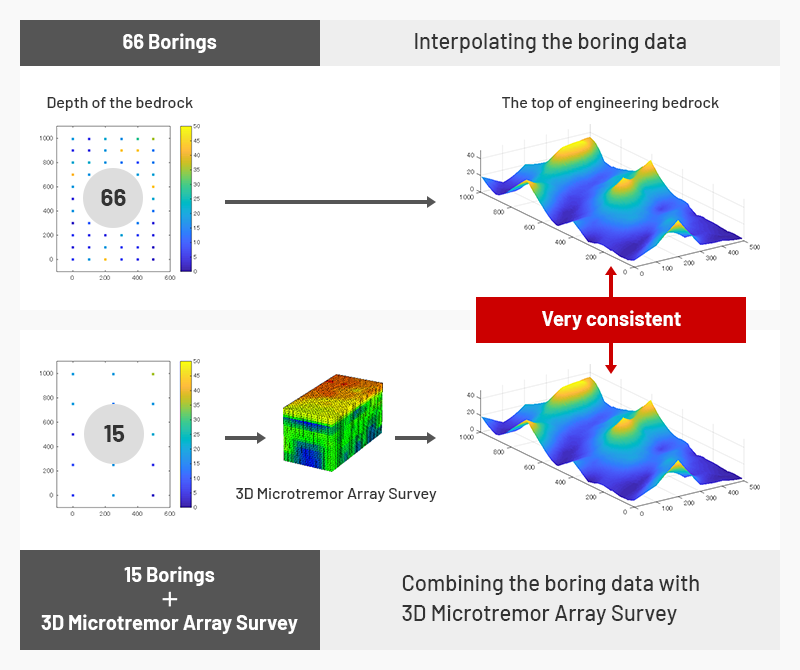
4. Microtremor Array Survey
Multiple sensors are deployed simultaneously or sequentially in an array configuration.
Array methods can provide additional information about:
- Surface-wave dispersion
- Shear-wave velocity
- Subsurface structure
Depending on the processing method and survey design.
5. Urban Microzonation Survey
A large number of microtremor measurement points are distributed across an urban area. The results can be combined using GIS to develop spatial maps.
Equipment Required for Microtremor Testing
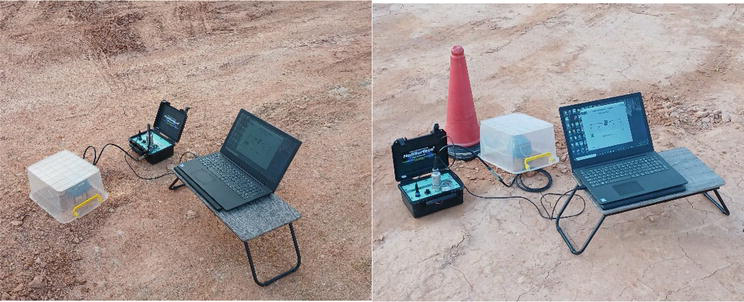
A typical professional microtremor survey requires:
|
Equipment |
Purpose |
|
Three-component seismometer |
Measures X, Y and Z ground motion |
|
Data logger |
Records seismic signals |
|
GPS/GNSS |
Coordinates and timing |
|
Battery |
Power supply |
|
Field tablet/computer |
Instrument control and QC |
|
Tripod/base plate |
Sensor stability where required |
|
Processing software |
Frequency and HVSR analysis |
|
Measuring equipment |
Site documentation |
|
Camera |
Site records |
The most important component is the high-sensitivity three-component seismic sensor. The sensor must be capable of detecting very small ground motions over the frequency range relevant to the investigation.
Microtremor Test Working Procedure
Step 1: Define the Project Objective
The first step is to determine what information is required.
For example:
- Predominant frequency
- Seismic site characterization
- Urban microzonation
- Sediment thickness
- Site-response investigation
- Geological interpretation
Step 2: Site Reconnaissance
The field team inspects the site. Important observations include:
- Traffic
- Buildings
- Construction
- Machinery
- Railway movement
- Electrical infrastructure
- Ground condition
- Surface vibration
Because microtremor uses ambient vibrations, nearby vibration sources can significantly affect the recorded data.
Step 3: Select Measurement Location
The sensor should be installed at a location representative of the investigation objective. The site should ideally provide:
- Stable ground
- Minimal direct disturbance
- Suitable sensor coupling
- Safe access
For urban surveys, complete elimination of environmental noise may not be possible. Instead, the field team should document and account for major vibration sources during interpretation.
Step 4: Sensor Installation
The three-component sensor is placed firmly on the ground. The sensor should be:
- Stable
- Properly coupled
- Protected from disturbance
Direct contact by people during measurement should be avoided.
Step 5: Orientation
The horizontal components are oriented according to the survey procedure. The sensor orientation should be recorded.
Step 6: Instrument Setup
The operator configures:
- Sampling rate
- Recording duration
- Sensor parameters
- Data storage
- Time synchronization
The parameters should be appropriate for the target frequency range.
Step 7: Ambient Vibration Recording
The instrument records natural ground vibrations. The operator should avoid unnecessary movement near the sensor. Nearby events should be documented.
For example:
10:20 AM – Heavy vehicle passed
10:35 AM – Construction activity started
These records can be useful during later data processing.
Step 8: Field Quality Control
The recorded signal is reviewed. The team checks:
- Signal amplitude
- Frequency content
- Sensor stability
- Excessive transient noise
- Data completeness
- Instrument performance
If the record is poor, additional measurements may be collected.
Working Steps on Field
A typical field workflow is:
Site reconnaissance
↓
Measurement-point selection
↓
GPS coordinate recording
↓
Sensor placement
↓
Ground coupling
↓
Sensor orientation
↓
Instrument setup
↓
Ambient vibration recording
↓
Field QC
↓
Repeat recording if required
↓
Data backup
↓
Move to next location
↓
Repeat measurements
↓
Complete field survey
Microtremor Data Processing
1. Data Import
The three-component seismic records are imported into appropriate processing software.
2. Data Inspection
The data are examined for:
- Missing records
- Instrument problems
- Saturation
- Excessive noise
- Transient events
3. Time-Window Selection
The continuous record is divided into appropriate windows. Windows containing strong unwanted disturbances may be rejected or separately evaluated.
4. Frequency Analysis
The time-domain signals are transformed into frequency-domain spectra. This allows the dominant frequency content to be identified.
5. Horizontal-Vertical Spectral Ratio
The horizontal and vertical spectra are compared. A representative H/V spectral ratio curve is produced.
6. Curve Smoothing
The spectral curve may be smoothed to reduce random fluctuations and identify stable spectral features.
7. Peak Identification
Potential peaks are evaluated according to:
- Frequency
- Amplitude
- Stability
- Bandwidth
- Directional behavior
- Window-to-window consistency
A peak should not be selected simply because it has the highest amplitude.
Applications of Microtremor Testing
1. Seismic Microzonation
One of the major applications is developing maps of ground-frequency characteristics. Multiple measurement points can identify spatial variations across cities.
2. Earthquake Hazard Assessment
Microtremor data can contribute to understanding how different sites may respond to earthquake shaking.
3. Building Site Investigation
Microtremor measurements can provide supplementary information about the dynamic characteristics of a building site.
4. Sediment Thickness Investigation
Predominant frequency can potentially be related to sediment thickness when appropriate velocity information is available.
5. Geological Investigation
Changes in frequency response may help identify variations in subsurface geological conditions.
6. Urban Planning
Microtremor surveys can support regional characterization where large-scale active-source surveys are impractical.
7. Infrastructure Projects
Potential applications include:
- Roads
- Bridges
- Railways
- Metro projects
- Airports
- Ports
- Industrial facilities
8. Seismic Site Response Studies
Microtremor data can contribute to evaluating local dynamic site characteristics.
9. Research and Academic Studies
Applications include:
- Earthquake research
- Basin studies
- Seismic microzonation
- Geological research
- Ground-response modeling
Advantages of Microtremor Testing
1. Passive Technique
No large active seismic source is normally required.
2. Non-Destructive
The method causes minimal physical disturbance.
3. Portable
Modern seismic sensors and recorders can be transported easily.
4. Suitable for Urban Areas
The absence of an active source makes microtremor attractive for many urban environments.
5. Rapid Deployment
A measurement point can generally be established without major site preparation.
6. Multiple Measurement Points
Many locations can potentially be surveyed to investigate spatial variability.
7. Useful for Seismic Studies
It can provide valuable information about predominant site frequency.
8. Complements Other Geophysical Methods
Microtremor can be combined with:
- HVSR
- MASW
- Seismic refraction
- Seismic reflection
- Downhole seismic testing
- Cross-hole seismic testing
- Borehole investigations
Limitations of Microtremor Testing
1. Ambient Noise Dependency
The method depends on naturally occurring vibrations.
Very noisy environments may complicate interpretation.
2. Cultural Noise
Traffic, machinery, construction, and human activity can produce strong transient signals.
3. Interpretation Is Non-Unique
A frequency peak does not automatically identify a particular soil or rock layer.
4. No Direct Bearing Capacity
Microtremor does not directly provide:
- Bearing capacity
- Cohesion
- Friction angle
- Settlement
- SPT N-value
5. No Direct Soil Classification
Microtremor frequency characteristics should not be used alone to classify soil.
6. Multiple Peaks
Complex geological conditions may generate several spectral peaks. Identifying the fundamental site frequency may require additional analysis.
7. Weak or Broad Peaks
Some locations may not produce a clear or stable peak.
8. Need for Supporting Data
For engineering applications, microtremor results should ideally be correlated with:
- Borehole data
- SPT
- MASW
- Downhole testing
- Geological information
Microtremor vs HVSR
|
Feature |
Microtremor |
HVSR |
|
What is it? |
Ambient vibration measurement |
Analysis method |
|
Data source |
Natural ground vibration |
Usually microtremor data |
|
Sensor |
Often 3-component |
Typically 3-component |
|
Main output |
Time/frequency characteristics |
H/V spectral ratio |
|
Predominant frequency |
Can be evaluated |
Commonly identified |
|
Site response |
Useful |
Very useful |
|
Relationship |
Measurement |
Analytical technique |
Therefore, it is technically better to describe the service as:
“Microtremor Survey with HVSR Analysis&r dquo;
when the actual service includes three-component ambient vibration recording and H/V processing.
Microtremor vs MASW
|
Feature |
Microtremor |
MASW |
|
Seismic source |
Ambient |
Usually active |
|
Main method |
Passive vibration recording |
Surface-wave analysis |
|
Main output |
Frequency characteristics |
Vs profile |
|
Active source required |
Normally no |
Usually yes |
|
Predominant frequency |
Useful |
Not primary output |
|
Shear-wave velocity |
Not directly obtained from basic HVSR |
Main output |
|
Urban application |
Often convenient |
Requires suitable source |
|
Site response |
Useful |
Useful through Vs model |
Using both techniques can provide complementary information.
Quality Assurance and Quality Control
Reliable microtremor measurements require careful field and processing procedures.
Instrument Verification
The sensor and recording equipment should be checked before field deployment.
Sensor Stability
The sensor must remain stationary during measurement.
Ground Coupling
The sensor should have suitable contact with the ground.
Environmental Monitoring
The field team should record:
- Traffic
- Machinery
- Construction
- Weather
- Human activity
- Nearby vibration sources
Recording Duration
Recording duration should be appropriate for the target frequency range and survey objectives.
Multiple Windows
Several windows should be analyzed rather than relying on one short data segment.
Peak Stability
Potential frequency peaks should be checked for consistency across different windows.
Repeat Measurements
Questionable locations should be measured again where practical.
Coordinate Verification
Measurement coordinates should be recorded accurately.
Data Backup
Raw recordings should be backed up immediately after fieldwork.
Independent Correlation
Important engineering interpretations should be compared with borehole, geological, and seismic velocity information.
Site and Health Safety
Microtremor testing is generally a low-impact field technique, but standard site safety remains necessary.
Potential hazards include:
- Road traffic
- Construction machinery
- Open excavations
- Uneven ground
- Electrical infrastructure
- Industrial facilities
- Weather conditions
- Waterlogged areas
Field personnel should use suitable PPE such as:
- Safety helmet
- High-visibility vest
- Safety footwear
- Gloves where appropriate
When working near roads, appropriate traffic-management procedures should be followed.
When working on construction sites, the survey team should comply with the site's safety requirements.
Future of Microtremor Services in Bangladesh
The demand for passive seismic investigation may increase as Bangladesh continues to deve lop its cities and major infrastructure.
Urban Seismic Microzonation
Large networks of microtremor stations can potentially be used to develop detai led maps of predominant frequency.
GIS Integration
Microtremor results can be integrated with:
- Geological maps
- Borehole databases
- Building information
- Elevation data
- Other geophysical datasets
This can support spatial seismic characterization.
Integration with MASW
Microtremor/HVSR can identify predominant frequency while MASW can provide shear-wave velocity information.
Together they can improve site characterization.
Integration with Boreholes
Borehole data can help correlate frequency peaks with actual geological boundaries.
Automated Processing
Future software can automate:
- Window selection
- Spectral calculation
- H/V calculation
- Curve smoothing
- Peak identification
- Quality assessment
Dense Urban Surveys
Portable equipment makes it possible to conduct measurements at many locations within a city or infrastructure corridor.
Digital Site Characterization
Microtremor data can eventually be incorporated into digital geological and engineering models.
Why Choose QC LAB SOLUTION for Microtremor Testing?
The quality of a microtremor investigation depends not only on the recording instrument but also on:
- Site selection
- Sensor installation
- Recording parameters
- Environmental assessment
- Data quality control
- Processing
- Interpretation
QC LAB SOLUTION can provide project-specific microtremor investigation services in Bangladesh, including:
- Project consultation
- Survey planning
- Measurement-point selection
- Three-component ambient vibration recording
- Field QC
- Microtremor data processing
- HVSR analysis
- Predominant-frequency assessment
- Spatial frequency mapping
- Integration with other geophysical data
- Technical reporting
For major engineering projects, microtremor surveys can be combined with MASW, seismic refraction, seismic reflection, ERT, boreholes, and other methods to develop a more reliable subsurface model.
The Microtremor Test is a valuable passive seismic investigation technique for measuring naturally occurring ground vibrations and evaluating the frequency characteristics of a site.
Unlike active seismic methods, microtremor surveys generally do not require a controlled seismic source. This makes them particularly useful for urban environments, seismic microzonation, earthquake engineering, geological studies, and rapid site characterization.
One of the most common analytical approaches is HVSR, in which horizontal and vertical spectral components are compared to identify significant frequency peaks.
Microtremor data can provide valuable information about:
- Predominant frequency
- Site resonance
- Subsurface impedance contrasts
- Sedimentary structures
- Seismic site characteristics
However, microtremor testing should not be considered a replacement for conventional geotechnical investigation. It does not directly provide soil strength, bearing capacity, settlement parameters, or SPT values. Interpretation can also be non-unique, particularly in complex geological environments.
For this reason, the most reliable approach is to combine Microtremor/HVSR with boreholes, SPT, MASW, seismic refraction, downhole seismic testing, geological mapping, and other appropriate investigation methods.
For construction, infrastructure, earthquake engineering, geological, and seismic hazard projects in Bangladesh, QC LAB SOLUTION can provide professional microtremor survey and passive seismic investigation services.